



 Climate Disinformation - The Persistent Scourge, by Jenna Wolfe, Ph.D.:
Disinformation is a persistent scourge in efforts to disseminate
accurate information with respect to climate issues. Research indicates
that a significant portion of the American public has been gravely
misinformed by inaccurate narratives fueled by disinformation campaigns
orchestrated by certain vested interests.
To combat climate change disinformation, the
University of Geneva in Switzerland has taken a novel approach to
address the problem
by developing and testing psychological interventions intended to
assist people in identifying and fending off disinformation. A team led
by
Dr. Spampatti conducted extensive research involving nearly 7,000
participants, and each finding of the study underscores the persuasive
nature of
disinformation and the urgent need to counteract it. According to
Spampatti, certain corporate interests, lobbying groups and political
organizations have been spreading disinformation for more than 30 years.
• The study found that these disinformation messages have created, "An unfounded acceptance of inaccurate climate reporting by the
corporate
media and in political speeches, and a vast underestimation of the
socio-financial
burden of climate policies based on falsified information." Spampatti
and his colleagues developed a theoretical framework based on the
psychology of climate change disinformation. This framework considers
various factors, including the source, content, recipients, and
psychological aspects influencing the processing of information. "As
individuals, we do not process scientific messages as neutral receivers
of information, but by weighing them up against our prior beliefs,
emotional ties and socio-cultural and ideological backgrounds.
Depending on the configuration of these psychological factors, false
information can be amplified and become resistant to correction,'' explains Spampatti.
Based on their findings, the researchers
developed psychological intervention strategies to prevent climate
disinformation from influencing people's climate-related beliefs and
actions. They tested these strategies on 6,816 participants. Each
strategy focused on a specific theme:
verified scientific data, trust in accurate climate data, transparent
communication, and positive emotions towards factual climate
information.
• Yet the science of countering disinformation is still young. "Our intervention strategies didn’t work as hoped," said Spampatti, lead author of the study and a
neuroscience researcher. According to the study, climate change disinformation
“persuades people extremely effectively, far more than factual scientific information does.” The disinformation the participants were
exposed to during the study—meant to simulate the "fake news" people encounter in the media and on social media platforms—had an enormous impact, effectively overwhelming the intervention strategies and accurate climate information.
"All
sorts of strategies that would seem to be potent turn out not to
persuade people—or they do, but the effect is ephemeral, with people
reverting to their original false beliefs in as little as a week." Part of the problem was the "genuine appeal" of disinformation. A
primary finding of the study, published in Nature Human Behavior, is
that climate change disinformation is more persuasive than scientific
facts.
The study found, quote: “There is an alarming persuasiveness within climate disinformation. We
found that the protective effect of our strategies is small and
disappears following additional exposures to disinformation, especially
via the media,” said Spampatti. “Once these beliefs have taken root, it’s harder to disabuse people of them. Climate
disinformation used in this study had a negative influence on people's
understanding of climate change realities and sustainable behavior.
Research in this field is still in its infancy. We are going to
continue our work and look for more effective forms of intervention.”
Examples of Climate Change Disinformation
The study found four primary areas of climate disinformation that have been, quote: "Very
effectively utilized by vested interests, especially when propagated
through the mainstream media and on social media platforms."
1. Hurricane frequency and intensity
2. Wildfire frequency and amount of land area burned
3. Historically unprecedented floods and droughts
4. Deaths resulting from climate change influenced events
Here is a detailed examination of those four (4) specific areas of climate change disinformation, along with the actual facts.
NOTE: Lest anyone misinterpret it, the purpose of the following is not
to suggest that climate change has not been occurring, but rather to
provide accurate data from top research centers that can assist in
understanding climate issues which are frequently misrepresented by the
corporate media, social media platforms, and some politicians.
• Also please note that, although the majority
of climate disinformation is intentionally created and disseminated to
support a very specific agenda, some is the result of scientists engaging in
what's called "pathological science." Pathological science is a psychological process in which a scientist—initially conforming to the scientific method—unconsciously veers from a rigorous methodology and begins an intractable process of what's called "wishful data interpretation,"
generally resulting from the observer-expectancy effect, cognitive
bias, and/or an ideological belief system. Pathological science
presents an often convincing but easily falsifiable claim, as is
apparent when the claim is compared to the true and factual data, as follows:
•1) Disinformation: "Climate change is causing more frequent and increasingly intense hurricanes."
This is false. FACTS:
The comprehensive record of all hurricanes that have made landfall
since 1851—including those as of November 1st, 2024—shows no upward trend in the number
of major hurricanes over the last 173 years. Moreover, there has been a
50 percent reduction
in the number of major hurricanes (Category 3 or greater) making
landfall in the U.S. over the last 90 years, since the 1930s.
Sources: National Oceanic and
Atmospheric Administration (NOAA); Princeton Geophysical Fluid Dynamics
Laboratory; U.S. Geological Survey; National Hurricane Center; National
Weather Service; High Meadows Environmental Institute, Princeton
University; et alia.
• A peer-reviewed study recently published in Nature, in Science News, and in Nature Communications, titled 'Changes in Atlantic Major Hurricane Frequency
Since the Late-19th Century', presented a very clear conclusion, quote: "There are not actually more Atlantic hurricanes now than there were roughly 150 years ago," and "There has been a significant decrease in the trend of hurricane energy and intensity over the past 25 years." The study was a comprehensive, cooperative effort of the following: Geosciences Department, Princeton University; High Meadows Environmental Institute; National Hurricane
Center; National Weather Service; National Oceanic and Atmospheric
Administration; and IIHR-Hydroscience &
Engineering, University of Iowa.
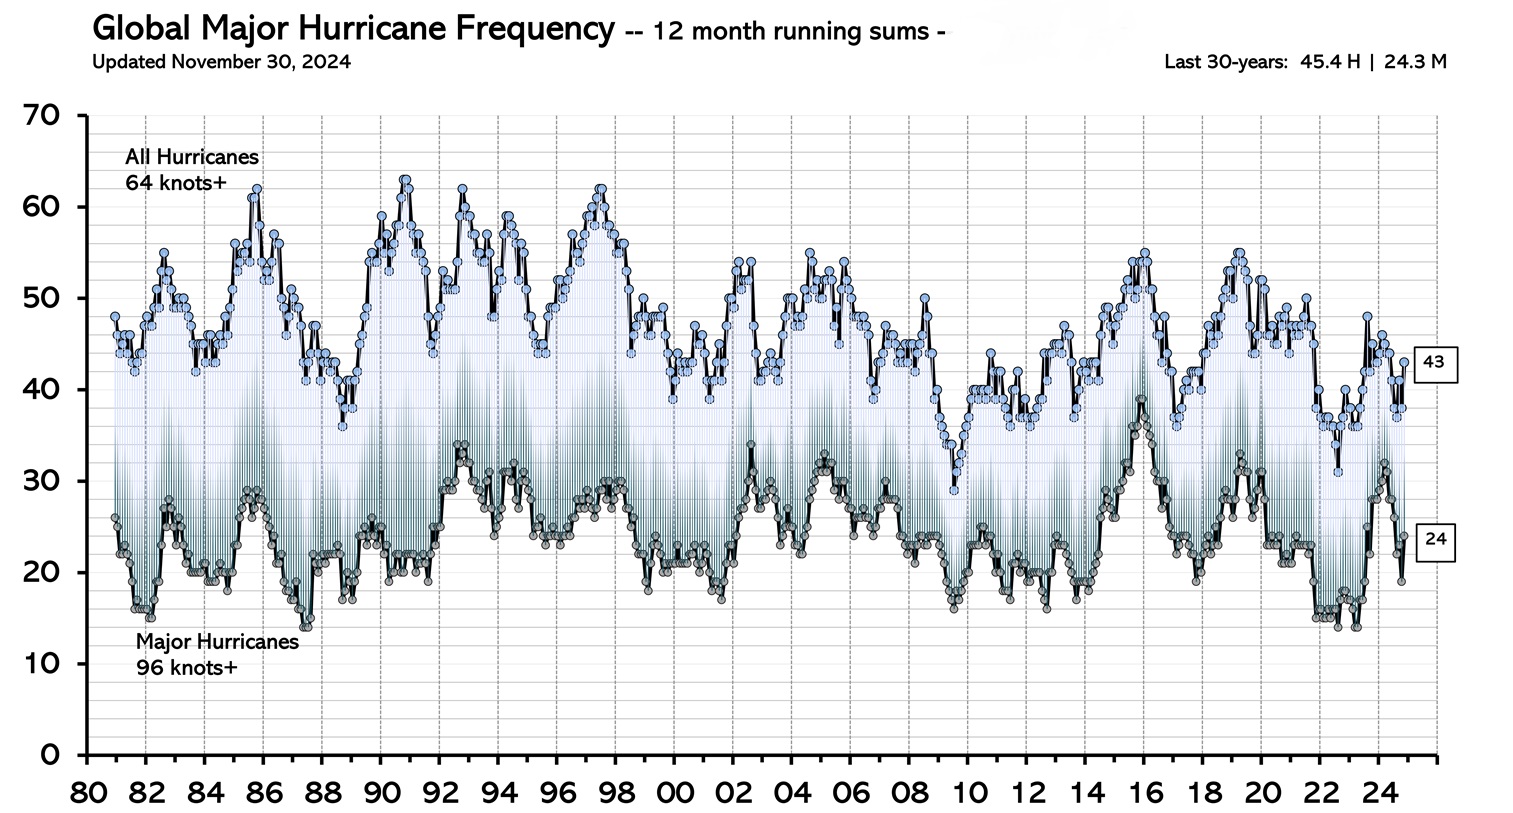
• This chart is from the Princeton Geosciences Department covering a period of 1981 through November 30, 2024.
•2) Disinformation: "Climate change is causing more frequent, larger and more intense wildfires."
Also false. FACTS:
The world's land area is 57,510,000 square miles (148,940,000 sq km),
which is 29.2% of the Earth's surface (70.8% is water and ice). Around
the turn of the century in 1900, an estimated 4.5% of the land area of
the world burned in wildfires every year, or an average of about
2,587,950 square miles annually. By the year 2000, NOAA and the NCDC
reported that this had declined
to 3.2%, or 1,840,320 square miles, a reduction of 29 percent. Then,
over the last two decades, NOAA satellites show an even further
decline. In 2021, about 2.7% burned, and in 2022 just 2.4% burned,
about 1,380,240 square miles, a REDUCTION of 47 percent in land
area burned, some 1,207,710 fewer square miles than in the early 1900s
(an area the size of India), and 460,080 fewer square miles than in 2000.
The data is showing the total amount of land area burned in 2023 is estimated to have been 2.6% of the world's land area, approximately 1,543,750 square miles, a REDUCTION of 41 percent in land area burned over the last 120 years, some 1,044,200 fewer square miles than in the 1900s.
And what about 2024? - The current data is showing the total amount of land area burned worldwide in 2024 was even less than in 2023, estimated to be approximately 1,505,798 square miles Sources:
National Oceanic and Atmospheric Administration (NOAA) Geostationary
Satellite Data, Washington, DC; the National Climatic Data Center (NCDC), Asheville, NC;
and the Princeton Environmental Institute, Princeton, NJ.
• FACTS:
In
the United States, the peak in the number of acres burned actually
occurred in 1930 with over 52,000,000 acres burned, compared to 7,577,183 in 2022, a DECREASE of 85%, and 2,634,910 acres burned in 2023, a DECREASE of 95% over the last 93 years. And the peak in the number of wildfires actually occurred in 1981 with about 244,890, compared to 69,988 in 2022, a DECREASE of 71%, 55,570 wildfires in 2023, a DECREASE of 77% over the last four decades, and an estimated 62,830 wildfires in 2024, a DECREASE of 32% from the year 2000. Sources:
The National Interagency Fire Center (NIFC), the nation's center for
wildland fires, providing statistics that encompass lands managed by
all federal, state, local, tribal, and private agencies; Princeton Environmental Institute, NJ.
Note:
If you wish, you can verify all of the foregoing data with NOAA, the
National Climatic Data Center, the Princeton Environmental Institute,
and the National Interagency Fire Center via each of their respective
official Office of Communication. Make sure to put a specific request
in the subject line of your e-mail so it's directed to the right
department within each agency.
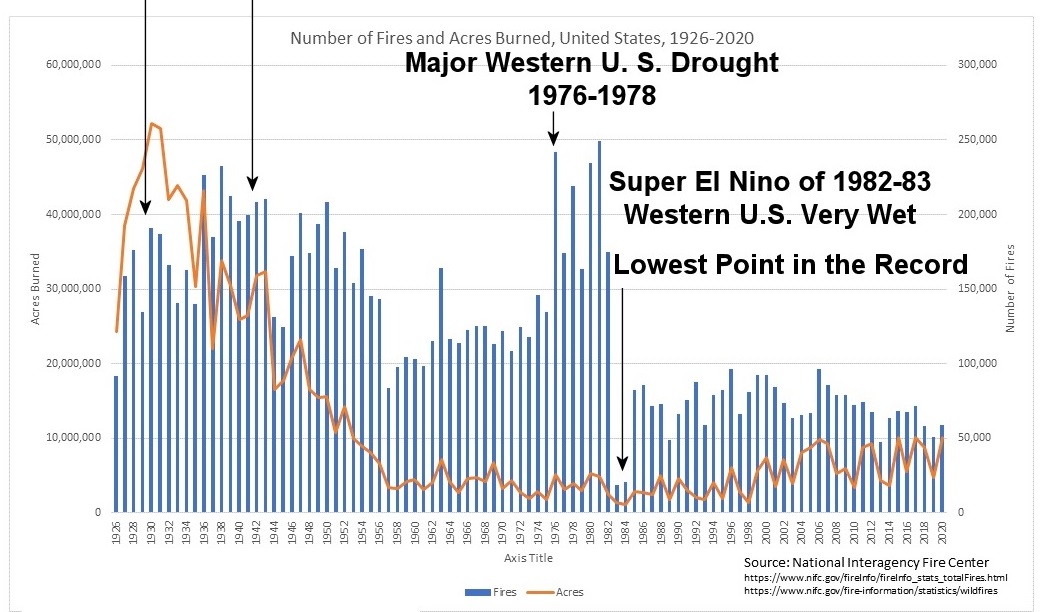
• This chart is from the National Interagency Fire Center covering a period from 1926 through 2020. Since the late 1970s and early 1980s, the actual number of wildfires in the United States has dropped by over 75%.
The arrows pointing down on the left side of the chart indicate the
true record years for heat and drought in the U.S., which occurred in
1930 through 1941, the era of the infamous "Dust Bowl," which began 93
years ago and ended 82 years ago. NOTE: Please beware of the disinformation where this chart has been censored by showing the first date at the
lowest point in the number of fires, the very wet year of 1983, to make it appear that wildfires are
becoming more frequent and burning more acreage, intentionally omitting
the previous 58 years, since that would be devastating to their false
narrative.
1930 1941
•
3) Disinformation: "Climate change is causing historically unprecedented floods and droughts."
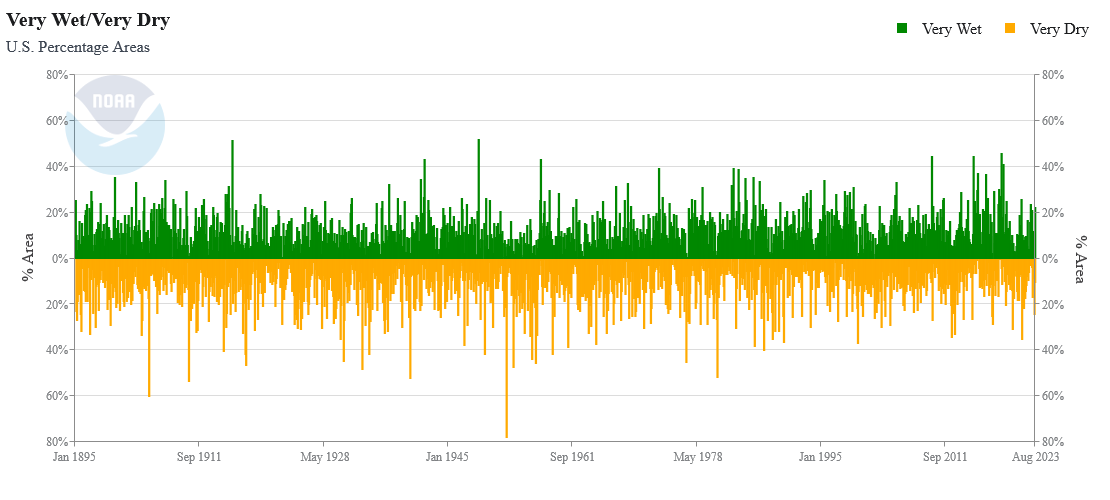
Also false. FACTS: A very clear graphic representation of the actual data is presented in this new chart from
NOAA's National Centers for Environmental Information titled "U.S. Percentage Areas Very Wet/Very Dry." The chart covers a period from January 1895 to August 2023—128 years—and is described as follows:
"Contiguous United States percentage areas are based on the U.S.
Climate Divisional Dataset. Climate divisions with a standardized
anomaly in the top ten percent (> 90th percentile) of their
historical distribution are considered 'very wet' and those in the
bottom ten percent (< 10th percentile) are classified as 'very dry'."
In other words, the chart clearly shows what
percentage of the U.S. was either unusually wet or unusually dry
through the entire time period of 128 years. You can see the results
for yourself, of course, but obviously
over the last several years there have been some wet and dry months,
yet despite the media's claims, nothing that exceeds many previous very wet or very dry months over the last 128 years. If you look closely, you can see that there have been dozens
of months going back to January 1895 that were either much wetter or
much dryer than in recent years.
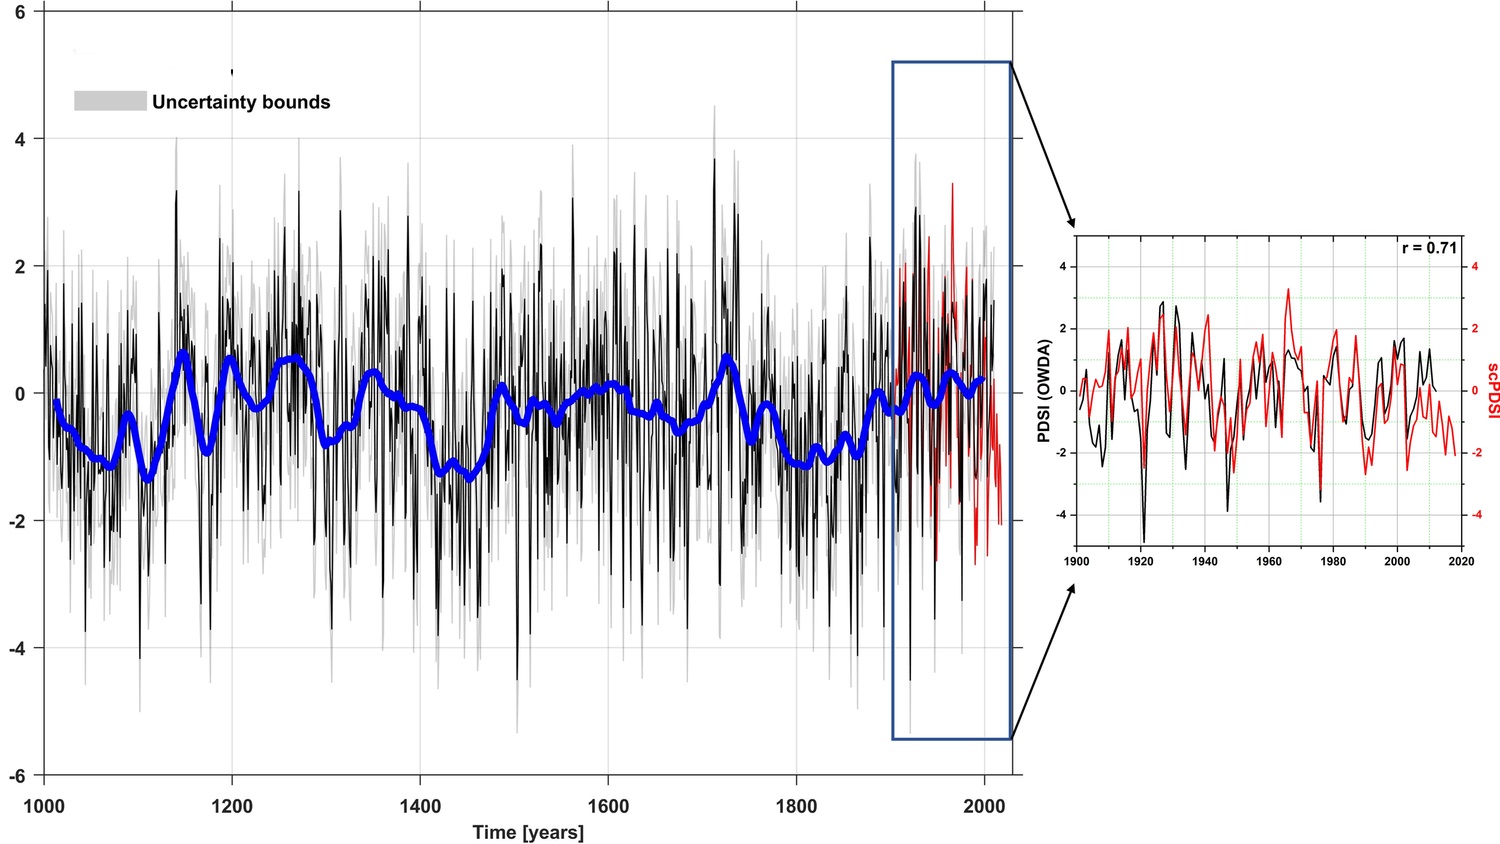
For
a much longer term view, the chart below depicts a reconstruction from
tree rings and other reliable proxies of the wet and dry pattern in
North America and Europe over the 1012
year period from the year 1000 to 2012, with direct observational data
from 1901 to 2018 displayed on the right. Dryness is denoted by negative values (below the 0 line), wetness by positive values (above the 0 line). The blue line denotes a running average of wet/dry periods. Sources:
NOAA's National Center for Environmental Information; The
National Science Foundation's Center for Atmospheric Research, Palmer
Drought Severity Index (scPDSI); Communications Earth & Environment, 2/61 (2021), et alia.
Again, you can see for yourself, but please
note that during the 118 year period from the
year 1900 through 2018 there are no exceptionally or unprecedentedly wet or dry periods, and the running average (blue line) is actually in a very stable pattern with little negative (dry) or positive (wet) fluctuation as compared to the preceding 900 years from 1000 to 1900.
• In summation, the information on the two charts makes it abundantly clear any claim that "Climate change is causing historically unprecedented floods and droughts" is baseless and represents a pure fabrication.
4) Disinformation: "Climate change is generating record death tolls worldwide."
Also absolutely false. FACTS:
The truth reveals one of the greatest accomplishments of modern
civilization. Comprehensive analysis from the OFDA/CRED International
Disaster Center, The Global Change Data Lab, and the Institute for
Health Metrics and Evaluation shows a dramatic decrease
in the global annual death rate from all climate related events
(hurricanes, tornadoes, floods, droughts, landslides, extreme
temperatures) over the last century. Deaths have fallen from a high of
0.61 per 100,000 people in the 1920s, when reliable, accurate records begin, to 0.04 per
100,000 people in the 2010s, a decrease of 93.4%.
The data for 2020 indicates a further drop to an estimated 0.031 per
100,000 people, an average decrease in climate related deaths of 22.5%
from the decade of 2010 to 2019.
And the International Disaster Center, Global
Change Data Lab, and Institute for Health Metrics released this report
in July 2023: "For 2022, the data is now complete and shows a
98.7% REDUCTION in the number of deaths from climate-related events
over the period of the last 100 years. Additionally, 2022 shows a
reduction of 58.8% in climate-related deaths from the year
2020."
Sources:
The OFDA/CRED International Disaster Database (Centre for Research on
the Epidemiology of Disasters), UniversitÚ Catholique de Louvain,
Brussels, Belgium; The Global Change Data Lab, a co-operative
organization of University College London, University of Oxford, and
the University of Bristol, England, UK; and The Institute for
Health Metrics and Evaluation, Population Health Center, University of
Washington, Seattle, WA.
• The chart below is from 'Our World in Data'.
The decadal record for the 103 year period from 1920 through 2023 is
based on EM-DAT data-sets, CRED data-sets, and incorporates data
from the OFDA International Disaster Database. For example, the bar for
1920 represents the numbers for 1920 through 1929, the bar for 2020 the numbers for 2020 through 2023, and so on. Note: Data for the years 1900 through 1919 is unavailable, incomplete, and/or unreliable.
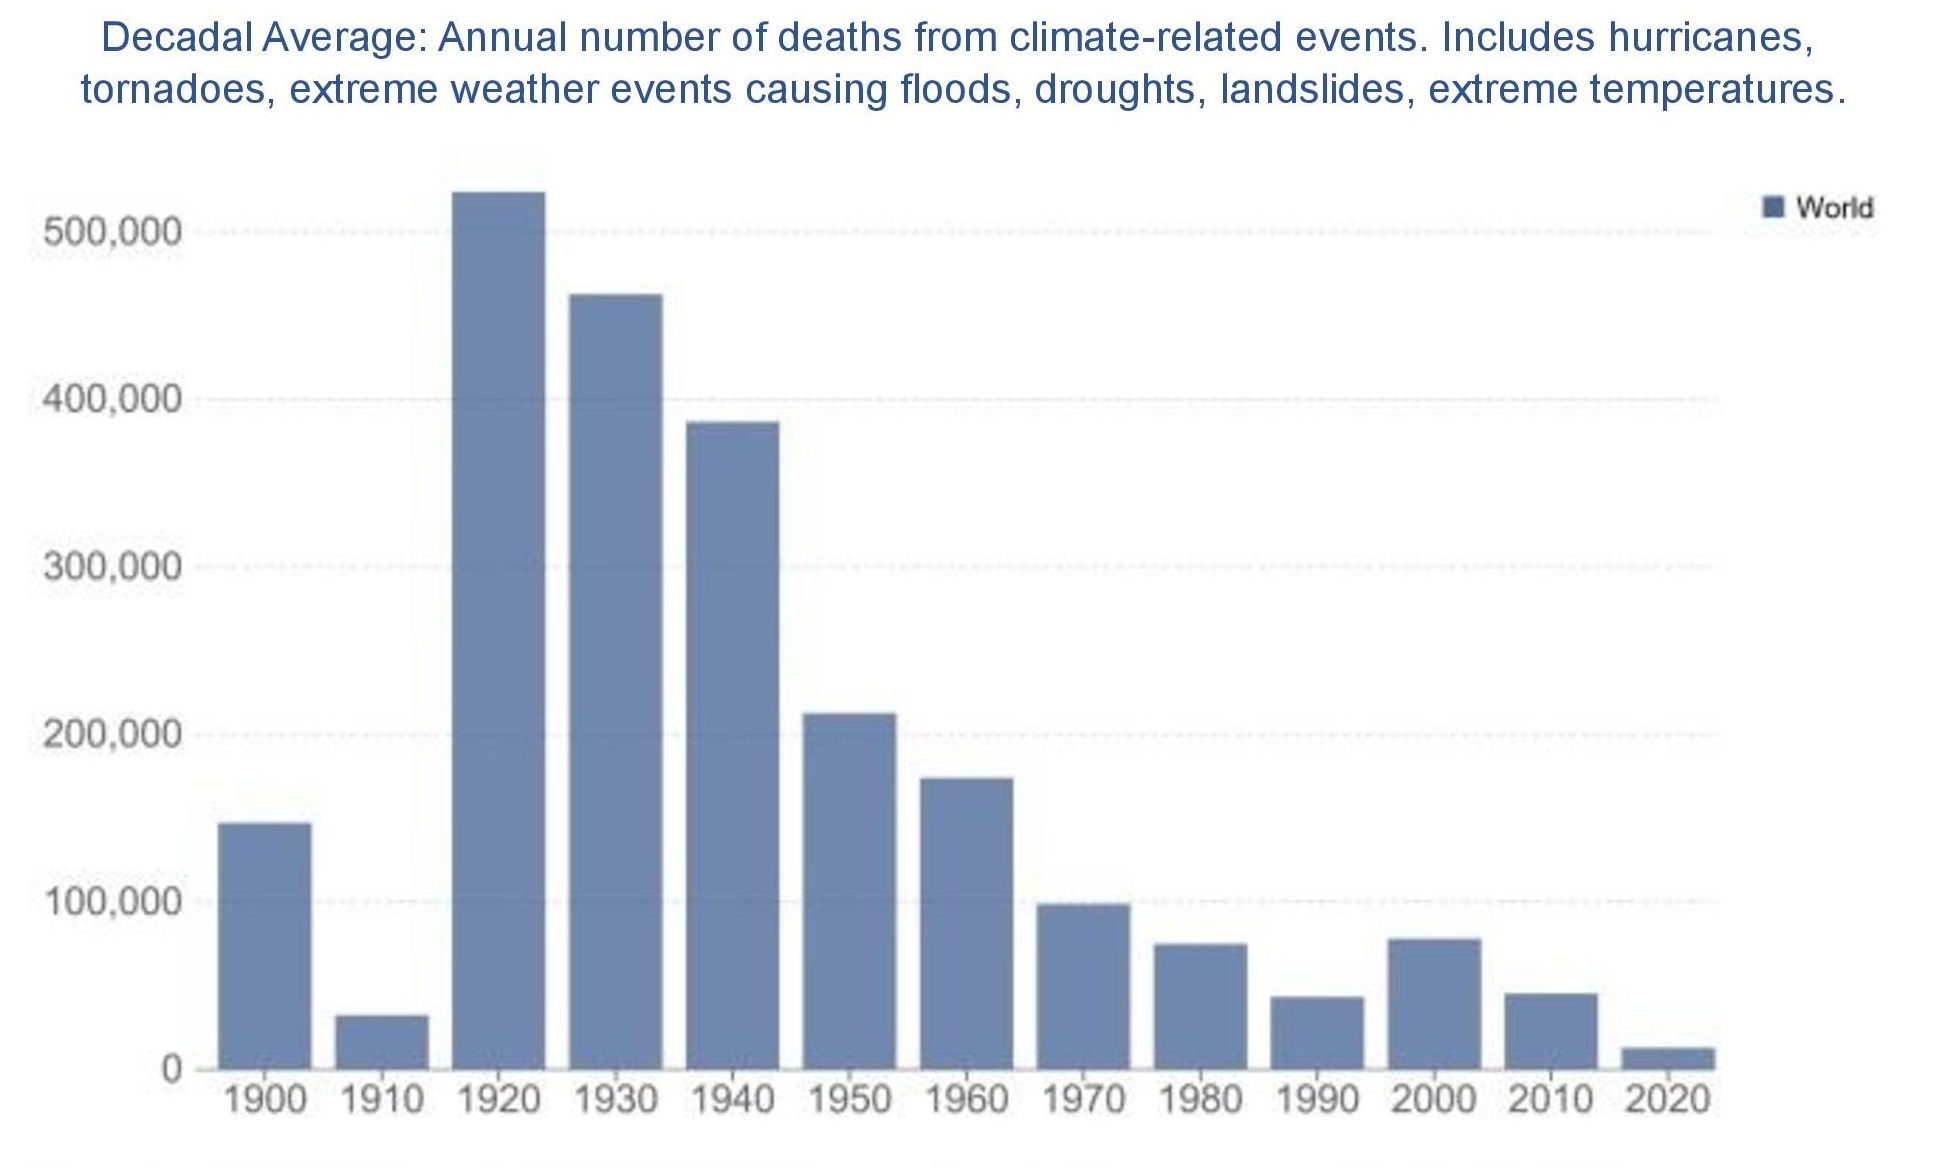
POINT: The study found this example of climate disinformation—"Climate change is generating record death tolls worldwide," in some cases baselessly claiming "15 million deaths each year"—is by far
the most heinous and destructive in its impact. A profound danger of
this extreme form of climate disinformation is the creation of stress,
grief, and despair, which has become a growing mental health problem.
An innovative study published in 'The Lancet' found that over half of
respondents between the ages of 16 and 25 reported feeling very or
extremely worried about the climate. This new form of mental stress has been
dubbed “climate anxiety” or “climate-catastrophe anxiety.” Defined as a
“heightened emotional, mental or somatic distress in response to
perceived changes in the climate system,” climate anxiety can create a
sense of hopelessness, grief, anger, guilt, and existential dread.
Distress about climate change is especially dangerous in young people
who have been indoctrinated by climate disinformation to believe that
they have no future, and that humanity is doomed. This erasing of the
line between fact and fantasy is extremely dangerous.
The study further noted: "The
indoctrination required to create climate-catastrophe anxiety succeeds
when disinformation causes people to disbelieve or ignore accurate
climate facts and data and thereby lose contact with the reality around
them, and without these contacts individuals lose the capacity of both
experience and thought. The ideal subject for climate-catastrophe
anxiety is not just the na´ve young person or the significantly
gullible, but people for whom the distinction between fact and
fiction—i.e., the reality of experience—and the distinction between
true and
false—i.e., the standards of thought—no longer exist."
•
Psychological Elements of Disinformation
The question is often asked: Why is climate change disinformation regarding hurricanes, wildfires, floods, droughts,
and alleged death tolls so appealing and
persuasive? Here's a deeper look from research and findings in the field of neuroscience.
Disinformation, climate or otherwise, acts as a kind of “surrogate life.” "You
absorb it so seamlessly that you might think you knew something—like
hurricanes supposedly increasing in number, say—before having been
exposed to disinformation from the primary CDI purveyors like IPCC and EDF, or secondary purveyors like CNN, MSNBC, NPR, Grist, Vox, the Guardian, USA Today or wherever. And you'll also retain that false
information even if you didn’t mean to."
This certainly seems like a liability:
Philosophers have long concerned themselves with what they call “the
paradox of propaganda”—why would we find fabricated stories emotionally
appealing at all? The answer is that most of our mind does not realize
that fiction is fiction, so we react to it as though it were real, and
the more it elicits an emotional reaction to a sense of danger or
threat the more real it seems.
Those who fabricate and disseminate climate
disinformation utilize this powerful psychological aspect of fear as a
very effective tool in creating a false sense of reality for the
consumers of their propaganda. A Berkeley psychology professor described disinformation as, quote, "An
extraordinary propaganda campaign directed at the young, the
uninformed, the mentally unstable, and the na´ve, utilizing powerful psychological techniques of
manipulation."
•"Our brains cannot help but believe."
• In
the field of psychology, this is known as scotomisation or motivated perception, which
means the way
in which the brain interprets the truth when it expects to see a
certain thing, the psychological tendency in people to see what they
want to see and not see what they don't want to see, often described as
"the mind sees what it wants to see." There’s
a great amount of experimental evidence for this. Children, for
example, sometimes believe that puppets are alive. Even
animals sometimes react to pictures the same way they react to real
things. The industrialized world is so full of representations and narratives, like in
media and in ads, that we forget that it’s just ink, or pixels on a computer screen.
"Every
time our
ancestors saw something that looked like a human face, it was one. When
they saw what looked like a water source in the distance, a stream or
pond, it actually was one. If they saw impala or wildebeests on the
horizon, they were real. As a result, we did not evolve to distinguish
reality from falsity. The same perceptual machinery interprets both.
These parts of our minds, even in the prefrontal cortex, do not know
that what we’re seeing, or reading, isn’t real." And these perceptual areas of our brains are very
closely connected to our emotions. That’s why emotions don’t just
motivate us to act in certain ways but force us to interpret the world
differently.